

A client asked me about Tarneit recently. Not whether to buy—she had already decided she wanted in. She wanted me to tell her the rent drop was temporary.
My honest answer? I thought it probably was. But I needed to understand why before I could say it with any confidence.
So I spent time in the data. Not just the price and yield snapshot — the population numbers, the building pipeline, the infrastructure story. Tarneit’s rents have fallen 1.9% over the past year. Vacancy is running at 4.8%. Most commentary will stop there and call it a caution. The data doesn’t stop there — and neither should you.
Here’s what’s happening, explained for investors who are looking at this market for the first time.
The Short Version
Growth corridor suburbs like Tarneit attract a particular kind of scepticism. “It’s just new estates.” “There’s nothing there.” “It’s all renters and first home buyers.”
Some of that is fair. Some of it is outdated. And some of it is people confusing short-term market conditions with long-term structural fundamentals.
Here is what the data shows.
Tarneit had 1,366 residents in 2001. It has 70,689 today. State government projections put it at approximately 125,000 by 2036. Its unemployment rate is 3.9% — below both the Victorian and national rates. Median household income is $109,356. Wyndham LGA has $12.8 billion in confirmed infrastructure investment, 89.5% of it in rail.
The near-term picture is more nuanced: rents have softened, vacancy is elevated, and price growth is steady rather than strong.
But the structural story — population, employment, economic growth, and infrastructure — is one of the more credible investment cases in metropolitan Victoria. Knowing the difference between those two stories is what this article is for.
Understanding What the Numbers Mean
Before we get into the data, a few terms that come up repeatedly — and that most commentary assumes you already know.
What is “Months of Stock”?
Months of stock measures how long it would take to sell every currently listed property in a suburb at the current rate of sales. Think of it as a reading on how tight or loose the market is. Below 3 months = seller’s market (low supply, upward price pressure) 3–6 months = balanced market Above 6 months = buyer’s market (more supply than demand) Tarneit currently sits at 3.6 months, below its 10-year average of 6.0. That means buyers have less choice than usual — even while rents have softened. The two can coexist because buyers and renters are different populations.
What does “Expansion Phase” mean?
Property markets move in cycles: Recovery → Expansion → Peak → Contraction. The “Expansion Phase” sits early-to-mid in that cycle. The key signals: supply is tightening, prices are tracking below or near their long-run trend (not above it), and the structural fundamentals are pointing toward future growth rather than away from it. For an investor, an Expansion Phase entry can mean you’re buying before prices have fully repriced — which is generally better than buying at the peak. The risk is that you may have a period of flat or modest returns before the market accelerates.
What is “Gross Rental Yield” and what does it tell you?
Gross rental yield = annual rent ÷ property value, expressed as a percentage. If a property is worth $670,000 and rents for $530 per week ($27,560 per year), the gross yield is 4.1%. It tells you the income return on your investment before costs. It does not account for maintenance, rates, property management, or loan interest — your net return will be lower. But it gives you a quick comparison between properties and markets. Tarneit’s 4.1% sits above Greater Melbourne’s 3.4%. For an investor who needs income to help cover costs, that difference is meaningful.
Investment Snapshot — February 2026
| Metric | Tarneit Suburb | Wyndham LGA | Greater Melbourne |
| Median Price (12m rolling) | $670,000 | $680,000 | $876,000 |
| 12-Month Price Growth | +3.1% | +3.6% | +2.0% |
| 5-Year Price CAGR | 3.3% | 3.2% | 2.6% |
| 10-Year Price CAGR | 5.2% | 5.6% | 4.1% |
| Median Weekly Rent | $530/wk | $510/wk | $580/wk |
| 12-Month Rent Growth | -1.9% | -1.9% | +0.9% |
| 5-Year Rent CAGR | 6.9% | 6.1% | 6.2% |
| 10-Year Rent CAGR | 4.5% | 3.8% | 3.9% |
| Gross Rental Yield | 4.10% | 3.90% | 3.40% |
| Months of Stock | 3.6 (avg: 6.0) | 3.0 (avg: 4.6) | 2.8 (avg: 3.5) |
| Annual Sales Volume | 1,777 | 6,837 | 69,032 |
| Unemployment Rate | 3.9% | 5.3% | n/a (5.1% VIC) |
Source: Cotality Market Trends, ABS SALM. February 2026. Price/rent figures are 12-month rolling medians.
Market Phase Assessment
Market Phase: Expansion — supply tightening, prices below long-run trend Entry Position: Neutral — pricing tracking around historical growth path Building Approvals: Moderating — approx. 20% below long-run average (4,044 vs 5,030/yr) Rental Market: Softening — rents -1.9%, vacancy 4.8% (above 3% balanced benchmark)
The Population Story — Why Growth Corridors Work
This is the number that anchors everything else.
Tarneit had 1,366 residents in 2001. By 2006 it had grown to 7,613. By 2016, 34,705. By 2024, 70,689. That is a compound annual growth rate of 18.7% over 23 years — one of the fastest-growing suburbs in metropolitan Victoria.
The Victorian government projects the suburb reaching approximately 125,430 residents by 2036. That would add roughly 54,741 people — essentially almost doubling the current population — in the next 12 years.
Importantly, the government projection is actually conservative. Tarneit’s historical CAGR from 2001 to 2024 was 18.7%. The projected CAGR from 2024 to 2036 is 4.89%. The forecast is well below what the suburb has historically delivered, which means the actual outcome may exceed projections.
| Year | 2001 | 2006 | 2011 | 2016 | 2021 | 2024 | 2026 (proj.) | 2031 (proj.) | 2036 (proj.) |
| Tarneit | 1,366 | 7,613 | 21,513 | 34,705 | 56,370 | 70,689 | 83,214 | 105,029 | 125,430 |
| Wyndham LGA | 86,604 | 115,161 | 166,699 | 227,008 | 296,322 | 335,320 | 360,453 | 416,732 | 472,122 |
| Tarneit as % of LGA | 1.6% | 6.6% | 12.9% | 15.3% | 19.0% | 21.1% | 23.1% | 25.2% | 26.6% |
Source: ABS Regional Population (Cat. 3218.0); VIC DELWP/VIF Population Projections.
CHART 1: Tarneit Population Growth 2001–2036 (actual + projected)
Type: Area or Line Chart
Data: 2001: 1,366 → 2006: 7,613 → 2011: 21,513 → 2016: 34,705 → 2021: 56,370 → 2024: 70,689 (actual). Then projected: 2026: 83,214 → 2031: 105,029 → 2036: 125,430. Use a different colour/shading for the projected portion (2024 onward).
Tool: Datawrapper — Line chart or area chart. This is the strongest single visual in the article. Make it large and prominent. Annotate the 2024 actual figure and the 2036 projection. The exponential curve is the whole story.
Why does population growth matter so much for property investors?
Because housing demand is, at its most basic level, a function of people. More people need more housing. More demand against finite supply pushes prices and rents upward over time. It’s not more complicated than that at the structural level.
Where investors get this wrong is confusing short-term market conditions — which can run against the long-term trend for periods of time — with the underlying structural story. Tarneit’s near-term rental softness is a short-term condition. Its population trajectory is a structural story. They are not the same conversation.
“1,366 people in 2001. 70,689 in 2024. 125,000 projected by 2036. That population story is the structural investment case — and it’s one of the strongest in metropolitan Victoria.”
What the Housing Market Is Doing
Tarneit’s median house price is $670,000 — 76.5% of Greater Melbourne’s $876,000 median. That relative affordability within a metropolitan growth corridor is part of the suburb’s appeal to both owner-occupiers and investors.
Price growth of 3.1% over the past 12 months is steady but not accelerating. The broader Wyndham LGA slightly outperformed at 3.6%. Both figures sit above Greater Melbourne’s 2.0%, which in a period of rate sensitivity is a reasonable result for an outer corridor market.
The 10-year price CAGR of 5.2% tells a more important story. From a base of $405,000 in 2016, prices have grown to $670,000 today. That is genuine wealth creation in real terms for anyone who bought a decade ago — and it happened in a suburb that commentators regularly dismiss as “too far out.”
The five-year CAGR of 3.3% reflects the moderation that followed the COVID-era surge and subsequent rate rises. This is a feature of the market cycle, not a structural problem.
CHART 2: Median Price Trajectory: Tarneit vs Wyndham LGA vs Greater Melbourne (2016–2026)
Type: Line Chart with Benchmark Comparison
Data: Tarneit: $405k → $670k (10yr CAGR 5.2%). Wyndham LGA: comparable trajectory. Melbourne: $608k → $876k. Show all three on one chart. Left axis: suburb + LGA scale. Right axis (or same): Melbourne if needed for legibility.
Tool: Datawrapper — Multi-line chart. Shows Tarneit’s steady appreciation against both its LGA and Melbourne benchmark over a full decade.
The Rental Market — What’s Actually Going On
This is the number that catches most people’s attention — and understandably so.
Median weekly rent in Tarneit has declined 1.9% over the past 12 months, from approximately $540 to $530. Vacancy sits at 4.8%, above the 3% level considered a balanced market.
In most of Australia right now, rents are rising. A suburb where rents are falling stands out. It deserves an explanation.
Near-Term Rental Headwind — Understand Before You Buy
Tarneit’s rental market is experiencing temporary oversupply caused by a high volume of new completions across the Wyndham corridor over recent years. When a large number of new properties settle in a short period, the rental supply temporarily outpaces rental demand — pushing vacancy up and rents down. This does not reflect weakness in the population story or the economic fundamentals. It reflects the timing of the development cycle. The key question is not “are rents falling now?” but “why, and will it continue?”
The answer to why is the building pipeline, discussed in the next section. The answer to whether it will continue is more optimistic: building approvals across Wyndham LGA are now running approximately 20% below their long-run average. Fewer new properties being approved today means fewer new completions in two to three years’ time — which is when the supply pressure should ease and rental demand, backed by the population trajectory, reasserts itself.
Vacancy at 4.8% is elevated but not extreme. For context: a vacancy rate above 3% is a renter’s market; above 5% is generally considered high. Tarneit sits between those points, which is uncomfortable for existing investors but not indicative of structural deterioration.
The five-year rent CAGR of 6.9% — above both the LGA (6.1%) and Greater Melbourne (6.2%) — shows that the long-run rental trajectory in Tarneit has been strong. The current softness is a deviation from that trend, not a new trend.
Building Approvals — Why Moderating Is Good News
One of the most useful things you can do as a property investor is understand the building pipeline in the areas you’re considering. In growth corridor suburbs, this matters more than almost anywhere else.
Why Do Building Approvals Matter for Investors?
Every dwelling that gets approved today will settle in roughly 12–24 months. The number of approvals is a leading indicator of future supply — how many new properties will be competing for tenants and buyers in the near term. High approvals → more supply coming → potential rental/price pressure Falling approvals → less supply coming → tightening conditions ahead This is why moderating approvals in Tarneit is actually a bullish signal for future rental conditions — even while current rents are soft.
Wyndham LGA building approvals are currently running at 4,044 dwellings per year on a 12-month rolling basis. The long-run average is 5,030 per year. The current rate is roughly 20% below that average.
After a COVID-era peak of 6,334 dwellings in FY2020–21 — which created the supply overhang now working its way through the rental market — approvals have moderated steadily. At current rates, the future completion pipeline is shrinking, not growing.
| Financial Year | Total Approvals | Per 1,000 Residents | vs Long-Run Avg |
| FY2016–17 | 4,742 | 19.6 | Slightly below |
| FY2017–18 | 5,936 | 23.0 | 18% above |
| FY2018–19 | 5,195 | 19.0 | 3% above |
| FY2019–20 | 5,351 | 18.6 | 6% above |
| FY2020–21 | 6,334 | 21.3 | 26% above (COVID stimulus peak) |
| FY2021–22 | 4,762 | 15.4 | 5% below |
| FY2022–23 | 4,260 | 13.2 | 15% below |
| FY2023–24 | 4,215 | 12.6 | 16% below |
| FY2024–25 | 4,557 | 13.1 | 9% below |
| 12m rolling (current) | 4,044 | 11.6 | 20% below |
Source: ABS Building Approvals (Cat. 8731.0). Wyndham LGA. Long-run average: 5,030 dwellings/year.
CHART 3: Wyndham LGA Building Approvals: FY2017–FY2025 with 12-Month Rolling
Type: Bar Chart with Reference Line
Data: Annual bars: 4,742 → 5,936 → 5,195 → 5,351 → 6,334 → 4,762 → 4,260 → 4,215 → 4,557. Add horizontal dashed reference line at 5,030 (long-run average). Annotate the FY2020–21 peak and the current 12-month rolling figure (4,044).
Tool: Datawrapper — Bar chart with overlay line. The visual story: the COVID-era spike that created today’s oversupply, and the clear moderation trend since FY2022. Shows the supply cycle turning — which is the bullish near-term signal.
“The supply overhang that pushed rents down was created by the 2020–21 approval spike. That spike is gone. Building approvals are now 20% below their long-run average. The cycle is already turning.”
The Economy and Employment Picture
Outer suburban growth corridors sometimes get dismissed as dormitory suburbs — places where people sleep but don’t work. The Wyndham employment data tells a more mature story.
The LGA’s employed resident population grew an estimated 78.7% between 2016 and 2023, compared with 17.4% across Greater Melbourne over the same period. That is nearly five times faster growth than the metro average — and all 11 of the largest employment sectors in the LGA grew over that period.
The sector mix is genuinely diverse: Health Care & Social Assistance leads at 16.4% of employment, followed by Retail Trade (11.7%), Transport & Logistics (11.1%), Professional Services (10.3%), and Construction (10.0%). Professional, Scientific & Technical Services — the sector most associated with knowledge-economy jobs — grew 119% over the period.
GRP for Wyndham reached $18.69 billion in 2025, growing at a CAGR of 10.7% from 2020 — above the national GDP growth rate of 7.0% over the same period. This is a local economy growing faster than the country, not an area being left behind.
For first-time investors, the household income figure is the most practical metric: Tarneit’s median household income is $109,356 per year. That’s a level that supports mortgage serviceability and, increasingly, the ability to rent at current price points.
| Year | Wyndham GRP ($B) | Australia GDP ($B) | Wyndham Growth |
| 2020 | $11.25B | $1,985B | Baseline |
| 2021 | $13.85B | $2,067B | +23% |
| 2022 | $15.12B | $2,309B | +9% |
| 2023 | $16.81B | $2,561B | +11% |
| 2024 | $17.77B | $2,673B | +6% |
| 2025 | $18.69B | $2,779B | +5% |
| CAGR 2020–25 | 10.7% | 7.0% | Above national rate |
Source: REMPLAN Economy (economy.id). GRP in nominal dollars.
The unemployment picture is another positive differentiator. Tarneit’s unemployment rate was 3.9% in December 2025 — below the Victorian rate of 5.0% and the national rate of 4.5%. This is not typical of outer suburban growth corridors, where unemployment often runs above state benchmarks. It reflects a community with genuinely robust employment participation.
The Infrastructure Story — This Is the Long-Term Case
If you are investing in Tarneit with a 10-year horizon, the $12.8 billion infrastructure pipeline is the most important section of this article.
| Project | Sector | Status | Est. Value |
| Melbourne Intermodal Terminal Package | Rail | Announced | $6.3B |
| OMR South Rail Connection (linked to above) | Rail | Announced | $1.8B |
| Western Interstate Freight Terminal (linked) | Rail | Announced | $1.5B |
| Level Crossing Removal – Western Program | Rail | Under Delivery | $1.8B |
| Western Treatment Plant upgrade | Water & Sewerage | Under Delivery | $711M |
| Little River BESS (battery storage) | Energy | Detailed Planning | $350M |
| Werribee Mercy Hospital ED Expansion | Social (Health) | Under Delivery | $280M |
| TOTAL | $12.8B |
Source: ANZIP Infrastructure Pipeline (infrastructurepipeline.org). Estimated project costs.
CHART 4: Infrastructure Pipeline by Sector ($12.8B total)
Type: Donut or Pie Chart
Data: Rail: $11.4B (89.5%), Water & Sewerage: $711M (5.6%), Energy: $350M (2.7%), Social: $280M (2.2%).
Tool: Datawrapper — Donut chart. Simple, high-impact visual showing that almost 90 cents in every dollar is going into rail. This is the key point for investors — rail infrastructure means permanent population access, not just construction jobs.
Rail is 89.5% of the total pipeline. That distinction matters enormously for property investors.
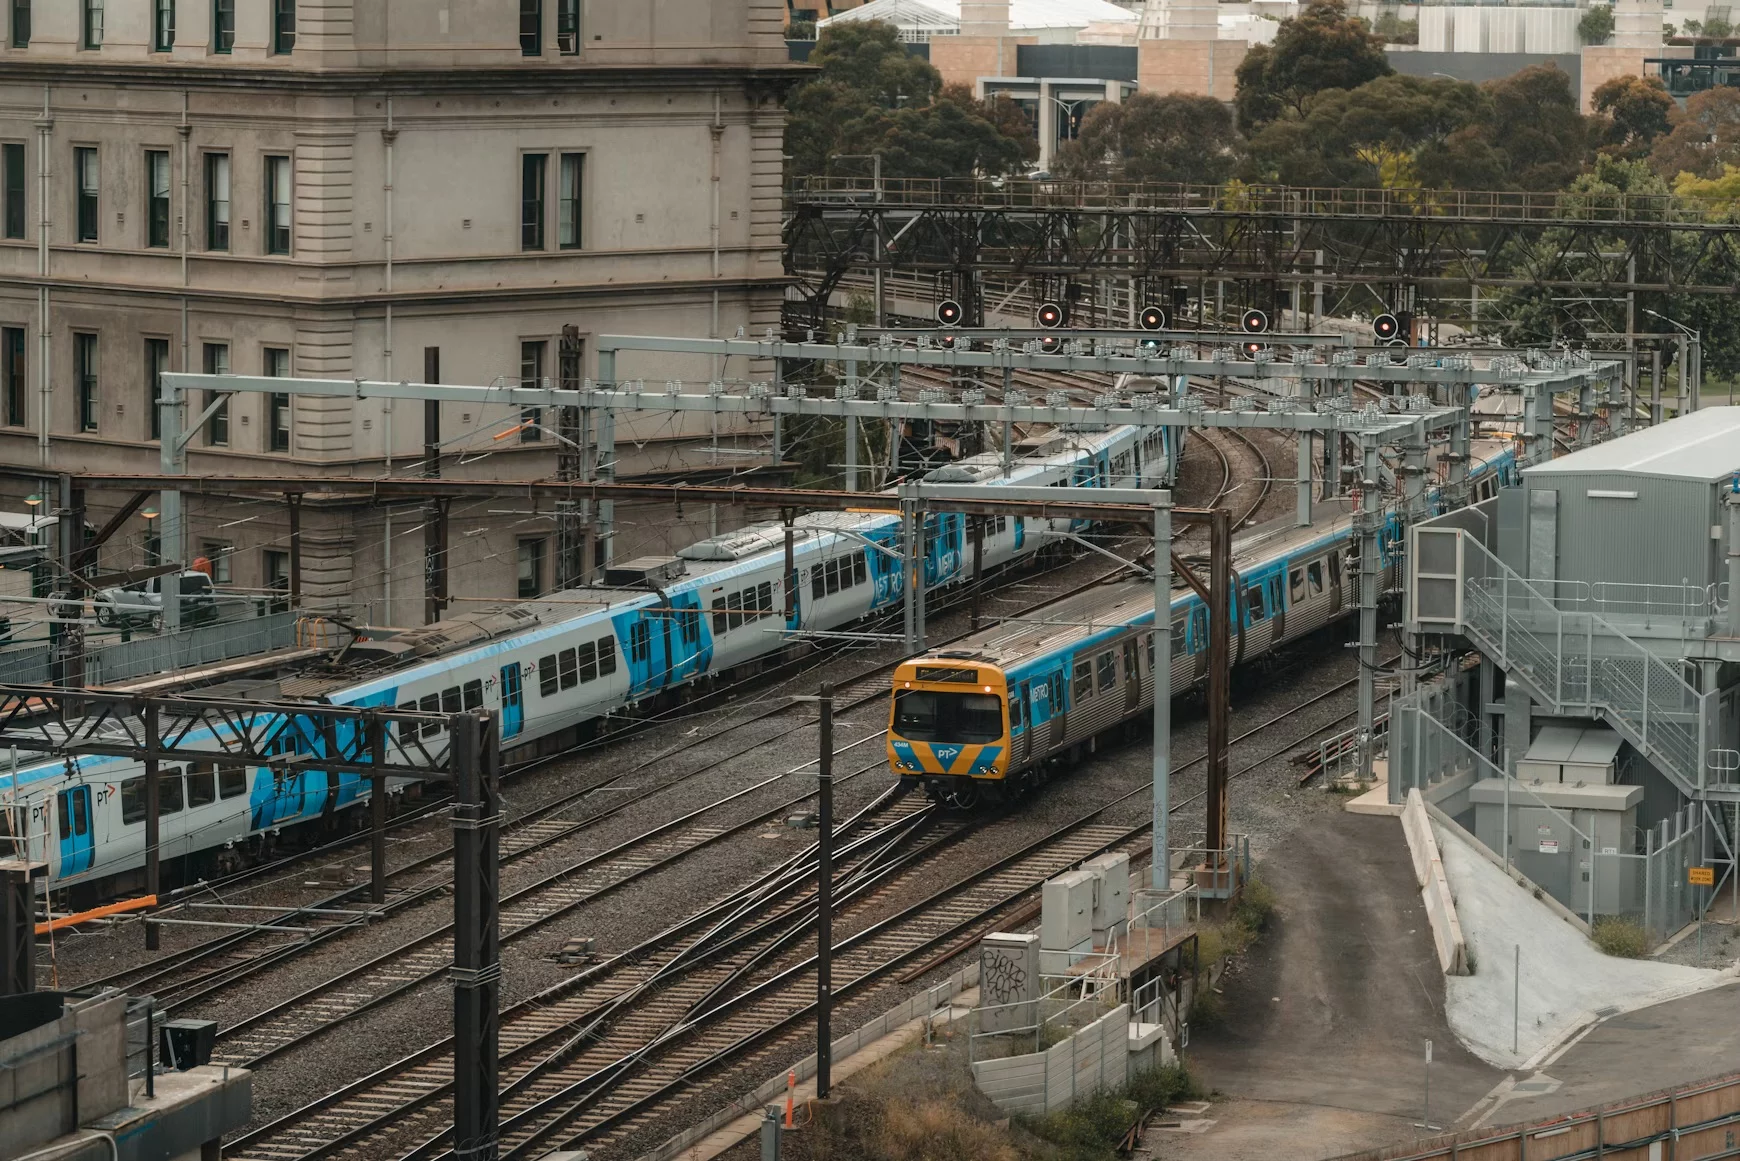
Overtime a suburb with a train line or improved rail connection effectively becomes closer to employment centres.
Why Is Rail Infrastructure Different From Other Infrastructure?
Not all infrastructure investment has the same effect on property values. Energy projects (solar farms, battery storage) create construction jobs. Road upgrades improve access. But rail does something different: it permanently expands the catchment of people who can realistically live in a suburb while working elsewhere.
When a suburb gets a train line or improved rail connection, it effectively becomes closer — in time — to employment centres. That permanently expands demand from buyers and renters who can now access the suburb without a car commute. The Melbourne Intermodal Terminal Package ($9.6B across three linked projects) will reshape freight logistics and connectivity for the entire western corridor. The Level Crossing Removal program ($1.8B, under delivery) directly improves train journey times. Together, these make Tarneit a more accessible suburb with each project that completes — which is a sustained tailwind for property values.
The Number That Made Me Stop
When I look at all the data on Tarneit, the number I keep coming back to is not a price figure or a yield. It is 1,366.
That was Tarneit’s entire population in 2001. Today it is 70,689. The government projects 125,000 by 2036.
That trajectory is genuinely unusual. It is not a projection built on optimism — it is a continuation of something that has already happened over 25 years. When you are evaluating a suburb, the question of who wants to live there is the most important question you can ask. Tarneit’s answer to that question has been very consistent.
How Tarneit Compares to Its Peers
Wyndham LGA’s closest structural comparables are Melton, Cardinia, and Whittlesea — all established Melbourne growth corridors. Against this peer group, Wyndham’s GRP growth rate of 10.7% CAGR is the standout performer. Its yield of 3.9% sits at the midpoint of the peer range. Its unemployment (5.3% at LGA level, 3.9% at suburb level) is broadly comparable with or better than peers.
The peer context matters for first-time investors because it helps calibrate expectations. Wyndham is not an outlier — it is performing consistently with the better end of its comparable peer group, with a stronger economic growth profile than most.
The Thing I’d Be Watching
If I was investing in Tarneit, the thing I would be watching is the rental recovery timeline. Specifically, whether vacancy starts pulling back from 4.8% toward the 3% balanced-market line over the next 12 to 18 months.
Building approvals are now 20% below their long-run average. The pipeline that created the oversupply is clearing. But “clearing” and “cleared” are different things — and rental income in the near term will reflect which side of that line you are on.
If you are buying with a five-plus year horizon, this is a manageable condition. If you are stretched on cashflow and need rents to hold from day one, stress-test those numbers before you commit.
The Honest Assessment
Let me be direct about what the data supports and what it doesn’t.
The structural case for Tarneit is sound. Population growth is among the strongest in metropolitan Victoria and is forecast to continue. The local economy is genuinely diversified and growing faster than the national rate. Employment is robust. The infrastructure pipeline — $12.8 billion, 90% in rail — is the kind of long-term investment that permanently reshapes a suburb’s accessibility and desirability.
The near-term conditions require honest acknowledgement. Rents have fallen 1.9% and vacancy at 4.8% means some landlords are waiting longer to find tenants. This creates short-term cash flow pressure for investors who are buying primarily for income. It is not a crisis, but it is real.
The moderating approval pipeline suggests the supply overhang will ease over time — but “over time” means 18 to 36 months, not six months.
Here is how I would frame the Tarneit investment decision for a first-time investor:
- If your hold period is less than three years: the near-term rental conditions make this less attractive. You may be holding through the soft patch and selling before the structural recovery fully materialises.
- If your hold period is five to ten years: the structural case is strong. The population trajectory, the infrastructure investment, the moderating supply pipeline, and the employment profile all point toward conditions improving over that timeframe.
- If you’re buying new estate product at the top of the price range: be cautious. The oversupply that’s pressing on rents is concentrated in newer estate stock. Established or near-established product, purchased at or below median, has a different risk profile.
- If you’re a first home buyer rather than an investor: the affordability relative to Melbourne, the employment fundamentals, and the suburb’s long-term trajectory make it a reasonable choice for a primary residence, where the rental market conditions are irrelevant to you.
“The near-term rental softness is the short-term story. The population, the employment, and $12.8 billion in rail infrastructure are the long-term story. Know which one you’re investing in.”
Frequently Asked Questions
Is Tarneit a good investment in 2026?
Tarneit has strong structural credentials for a medium-to-long-term investment: sustained population growth (18.7% CAGR over 23 years), below-average unemployment, a diversified metro economy growing faster than the national rate, and $12.8 billion in infrastructure investment dominated by rail. The near-term concern is rental market softness (rents -1.9%, vacancy 4.8%), driven by a supply overhang from Wyndham’s development cycle. Building approvals are moderating, which should ease supply pressure over time. For investors with a five-to-ten year horizon, the fundamentals are sound.
What is the median house price in Tarneit in 2026?
The median house price in Tarneit is $670,000 as at February 2026 — 76.5% of Greater Melbourne’s median of $876,000. The 12-month price growth is 3.1% and the 10-year price CAGR is 5.2% (from a base of $405,000 in 2016).
Why are rents falling in Tarneit?
Rents in Tarneit have fallen 1.9% over the past year and vacancy sits at 4.8%, above the 3% balanced market benchmark. This reflects temporary oversupply caused by a high volume of new dwellings completing across the Wyndham corridor — a direct consequence of the COVID-era approval surge that peaked in FY2020–21 at 6,334 dwellings. Building approvals have since moderated to approximately 4,044 per year, 20% below the long-run average. As the completions pipeline contracts, supply pressure should ease and rental conditions should recover.
What is the unemployment rate in Tarneit?
Tarneit’s unemployment rate was 3.9% in December 2025 — below both the Victorian rate of 5.0% and the national rate of 4.5%. This is a positive differentiator relative to many outer suburban growth corridor markets.
What infrastructure is planned for the Tarneit area?
Wyndham LGA has $12.8 billion in confirmed infrastructure projects. The dominant investment is rail — $11.4 billion (89.5%), including the Melbourne Intermodal Terminal Package ($9.6B across three linked projects) and a $1.8 billion Level Crossing Removal program currently under delivery. Rail infrastructure is significant for property investors because it permanently expands the catchment of potential residents by reducing commute times to employment centres.
Is Tarneit suitable for first home buyers?
Tarneit offers relative affordability within metropolitan Melbourne ($670,000 median vs $876,000 for Greater Melbourne), strong population growth, below-average unemployment, and a well-regarded school and services network that is expanding with the population. The current rental market softness is relevant to investors but not to owner-occupiers. For first home buyers looking for a family home with long-term fundamentals, Tarneit is a reasonable choice — provided you understand the commitment to a growth corridor lifestyle and timeline.
How does Tarneit compare to other Melbourne growth corridor suburbs?
Tarneit’s closest structural comparables are Melton, Cardinia, and Whittlesea. Against this peer group, Wyndham LGA’s economic growth rate (10.7% CAGR 2020–2025) is the standout figure. Yield at 3.9% sits at the midpoint of the peer range. The $12.8 billion infrastructure pipeline, particularly the rail investment, is substantially larger than most comparable LGAs.
Related articles
The Questions First Home Buyers Don’t Know to Ask
Why Smart People Make Bad Property Decisions
Property Investing in Australia: 10 Real-World Rules
Urgency Is a Sales Tool. Here’s How to Recognise It
Sources & references
The following sources are relevant to the content covered in this article.
Cotality Market Trends (DS-010) — Median price, rent, yield, months of stock, sales volumes. February 2026.
ABS Regional Population (Cat. 3218.0) — Estimated Resident Population 2001–2024, SA2 and LGA level.
VIC DELWP/VIF Population Projections — SA2 and LGA forecasts to 2036.
ABS Census General Community Profile (GCP) DataPacks — G01, G02, G32, G33 — 2011, 2016, 2021. Suburb and LGA level.
ABS Building Approvals (Cat. 8731.0) — Monthly dwelling approvals, Wyndham LGA, July 2016 – March 2026.
REMPLAN Economy (economy.id) — Gross Regional Product, Wyndham LGA, 2020–2025.
ABS Small Area Labour Markets (SALM) — Quarterly unemployment rate, SA2 and LGA level. December 2025.
ABS Labour Force (Cat. 6202.0) — Monthly employment status, Victoria and Australia.
ANZIP Infrastructure Pipeline — Wyndham LGA confirmed projects. May 2026.
Jobs and Skills Australia — Employment Projections May 2024–May 2034. National industry projections.
Disclaimer
This article contains general information only and does not constitute financial, legal or tax advice. Please speak to a licensed financial advisor, solicitor or mortgage broker about your specific circumstances. Aimee Templeman is a licensed real estate agent however approaches property through the lens of learning and empowerment. She has decades of experience coaching and advising everyday Australians and executive decision makers. Book a conversation with Aimee at Contact.